By: Griffin T. Murphy, Jay Patel, Leslie I. Boden, and Jennifer Wolf
Published: October, 2021
The 24th annual workers’ compensation report produced by the Academy provides the only comprehensive data on workers’ compensation benefits, coverage, and employer costs for the nation, the states, the District of Columbia, and federal programs. Trends in this five-year study period (2015-2019) largely continue those presented in the past few reports. Additionally, this year’s report implements improved methods to estimate employer costs and incorporates more state-agency data to create the most accurate report to date.
Executive Summary
Introduction
Like other social insurance programs – e.g., Social Security, Medicare, and Unemployment Insurance – workers’ compensation uses contributions from employers and workers to provide support for workers when they need it. As the first social insurance program to be implemented in the United States, the first states adopted workers’ compensation in the early 1910s, when federal-level programs were not yet considered legally acceptable. Other states quickly followed suit, with 43 states having enacted workers’ compensation laws by 1920.
In the century since, workers’ compensation has served as a critical protection for workers and their families, providing medical care and, when appropriate, cash support. (It also pays funeral expenses and survivor benefits for those whose injuries result in death.) It has evolved to protect not only those injured at work, but also certain cases of those who become ill due to workplace factors, though occupational diseases have been less clearly and consistently covered.
As a state-based system, measuring the impact of annual legislative and regulatory changes on employers and workers nationally is difficult. This makes the National Academy of Social Insurance Report on Workers’ Compensation Benefits, Costs, and Coverage an important and unique work.
Since 1996, the Academy has produced the nation’s only annual report providing data on coverage of the U.S. labor force, the cost of that coverage, and benefits paid to workers at both the national level and across states. Annual reports provide data updated to two years prior – in this case, the most recent data are from 2019 – as well as updates on the preceding four years (2015-18), and twenty-year trends for key metrics.
This executive summary highlights key findings and trends from the report, which is available on this website.
Key Findings and Trends in Workers’ Compensation
Total benefits paid rose slightly, standardized benefits fell.
While overall, total benefits paid rose slightly over the five-year study period from 2015 to 2019, standardized benefits fell, continuing a ten-year trend. (Table 1)
- Total benefits paid rose 0.4%. Cash benefits increased by 2.0%, but medical benefits declined by 1.1%.
- Standardized cash and medical benefits fell by 14.0% and 16.7%, respectively, combining for a 15.4% decline in total standardized benefits between 2015 and 2019.
Total employer costs rose less than worker benefits.
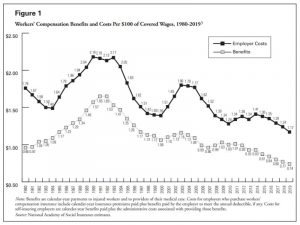
Total employer costs rose less than worker benefits, and fell more than benefits on a standardized basis, also sustaining a long-term trend. (Table 1)
- Total costs rose by 0.9% over the five-year period, due to an increase of 1.6% between 2015 and 2017, followed by a small decrease of 0.6% in the following two years. Adjusted for labor-force growth, standardized employer costs declined over the entire period, by 0.09 from 2015-2017 and $0.12 from 2017-2019, for a total decline of $0.21 per $100 of covered wages.
- Total employer costs for workers’ compensation in 2019 were $100.2 billion.
- 2019 was the first year since 2010 that unadjusted costs declined. I.e., total employer costs for workers’ compensation insurance were over one million dollars lower in 2019 than in 2018, despite the increase in the number of covered workers. (Table 13)
- The long-term trend of a decline in standardized costs continued, down 34.8% to $1.17 since peaking in 2003 at $1.80. (Table 15)
Coverage continued to increase.
Coverage continued to increase, largely because the labor force has continued to expand, a fairly consistent trend. (Table 1)
- In 2019, workers’ compensation covered 144,407,000 jobs across the country, with a total of $8.6 billion in covered wages.
- Measured by covered jobs, workers’ compensation coverage increased by 3.2% from 2015 to 2017, and by 2.8% in the following two years, for a total increase of 6.2%.
- Covered wages increased even more, by 8.0% over the first two years of the study period, and 9.9% since 2017 for 18.7% total growth over the study period.
- Both five-year patterns are consistent over the past twenty years. The exceptions are for covered jobs, which saw small declines in 2001-2003 and during the Great Recession between 2008 and 2010, and for covered wages in 2009. (Table 2)
State-level data and outliers
- Benefits:
- There are considerable cross-state differences within standardized benefits, where only one state, Hawaii, saw an increase over the study period. (Table 12) Declines ranged from 2.4% in Massachusetts to 30.5% in Tennessee and 33.1% in Oklahoma.
- Over that period, 24 states observed standardized benefit declines exceeding 15%, and 11 of those states, exceeding 20%.
- Costs:
- Like benefits, standardized employer costs vary substantially across states from the 15.0% national-average decline over the study period. (Table 14) In Hawaii, standardized costs rose by 1.9%. Decreases in the other states range from 4.5% in Massachusetts to 30.8% in Oklahoma and a massive 40.2% figure in Tennessee. In all, standardized costs declined by more than 15% in 31 states, and by more than 20% in 13 states.
- Coverage:
- Coverage consistently increased across states, albeit at very different rates, largely reflecting growth in employment. The only five exceptions are Alaska, Louisiana, North Dakota, West Virginia, and Wyoming. (Table 3) Even in those states, covered wages increased. (Table 4)
Other Trends
- Benefit-to-Cost Ratio. The ratio of benefits paid to the cost of coverage has fallen substantially in the past two decades. (Table 15)
- In 1999, benefits represented 80 cents of every dollar in employer costs. In 2019, that ratio had fallen by 21.2%, to 63 cents.
*Annual benefits and costs don’t correspond precisely, as benefits include payments for claims in current or past years, and employer costs include premium payments to cover benefits in future years, in addition to deductible payments, self-insurer payments, administrative costs, and assessments. Still, this large decline is noteworthy. 2019 was the first year that the ratio increased since 2010.
- In 1999, benefits represented 80 cents of every dollar in employer costs. In 2019, that ratio had fallen by 21.2%, to 63 cents.
- Medical vs. Cash Benefits. While medical benefits as a share of total benefits have increased in recent decades (with the share attributable to cash benefits shrinking), the national average masks enormous variation across states. In 2019, for example, medical benefits constituted 49.6% of all workers’ compensation benefits paid out, yet they are only 29.8% of benefits in D.C. and 79.1% of benefits paid in Wisconsin. (Table 8)
- Deductibles. In recent decades the share of workers’ compensation benefits paid under deductible provisions has grown. That share was 12.3% in 1999, up to 17.6% in 2019, for a 43% increase. (Table 6)
Conclusion
Workers’ Compensation Benefits, Costs, and Coverage – 2019 Data contains nineteen tables, seven figures, and five appendices covering national and state level data relevant to workers’ compensation outcomes. These data range from benefits, costs, and coverage to Department of Labor data on injuries and fatalities, and data on the overlaps between Social Security disability insurance and the workers’ compensation system. Certain source data are available upon request to Griffin Murphy, gmurphy@nasi.org, or Jay Patel, jpatel@nasi.org.
Resources:
Report: 2021 Workers’ Compensation Report – 2019 Data
Executive summary: Workers’ Compensation: Benefits, Costs, and Coverage (2019 Data)
Press release: Considerable cross-state differences in workers’ compensation, as a ten-year trend of declining benefits nationally continues
Previous Annual Reports:
2020 | Workers’ Compensation Benefits, Costs, and Coverage – 2018 Data
2019 | Workers’ Compensation Benefits, Costs, and Coverage – 2017 Data
2018 | Workers’ Compensation Benefits, Costs, and Coverage – 2016 Data
2017 | Workers’ Compensation Benefits, Coverage, and Costs – 2015 Data
2016 | Workers’ Compensation Benefits, Coverage, and Costs – 2014 Data
2015 | Workers’ Compensation: Benefits, Coverage, and Costs – 2013 Data
2014 | Workers’ Compensation: Benefits, Coverage, and Costs – 2012 Data
2013 | Workers’ Compensation: Benefits, Coverage, and Costs – 2011 Data
2012 | Workers’ Compensation: Benefits, Coverage, and Costs – 2010 Data
2011 | Workers’ Compensation: Benefits, Coverage, and Costs – 2009 Data
2010 | Workers’ Compensation: Benefits, Coverage, and Costs – 2008 Data
2009 | Workers’ Compensation: Benefits, Coverage, and Costs – 2007 Data
2008 | Workers’ Compensation: Benefits, Coverage, and Costs – 2006 Data

dddddddddddddddddd

